Wireshark命令行下的用法。

Wireshark命令行下的用法

1.安装

可以访问到下面这链接里面,能够看到可以下载安装包

1
https://www.wireshark.org/index.html#download

在这里选择对应的版本系统即可,具体安装过程略,可以自行百度。

2.配置

安装完成之后可以在安装路径下面看到存在两个tshark.exe、Wireshark.exe

其中Wireshark.exe是图形化界面,tshark.exe是命令行界面

然后复制环境变量添加到用户变量和系统变量中,有可能需要重启才能生效

然后在cmd中能够输出执行这个命令tshark.exe -h并输出下面结果即可

3.使用说明

3.1中文说明文档

1
2
3
4
5
6
7
8
9
10
11
12
13
14
15
16
17
18
19
20
21
22
23
24
25
26
27
28
29
30
31
32
33
34
35
36
37
38
39
40
41
42
43
44
45
46
47
48
49
50
51
52
53
54
55
56
57
58
59
捕获接口:  
-i: -i <interface> 指定捕获接口,默认是第一个非本地循环接口;
-f: -f <capture filter> 设置抓包过滤表达式,遵循libpcap过滤语法,这个实在抓包的过程中过滤,如果是分析本地文件则用不到。
-s: -s <snaplen> 设置快照长度,用来读取完整的数据包,因为网络中传输有65535的限制,值0代表快照长度65535,默认也是这个值;  
-p: 以非混合模式工作,即只关心和本机有关的流量。  
-B: -B <buffer size> 设置缓冲区的大小,只对windows生效,默认是2M;  
-y: -y<link type> 设置抓包的数据链路层协议,不设置则默认为-L找到的第一个协议,局域网一般是EN10MB等;  
-D: 打印接口的列表并退出;  
-L 列出本机支持的数据链路层协议,供-y参数使用。
捕获停止选项:  
-c: -c <packet count> 捕获n个包之后结束,默认捕获无限个;  
-a: -a <autostop cond.> ... duration:NUM,在num秒之后停止捕获;                  
filesize:NUM,在numKB之后停止捕获;                 
files:NUM,在捕获num个文件之后停止捕获;
捕获输出选项:  
-b <ringbuffer opt.> ... ring buffer的文件名由-w参数决定,-b参数采用test:value的形式书写;              
duration:NUM - 在NUM秒之后切换到下一个文件;                
filesize:NUM - 在NUM KB之后切换到下一个文件;                
files:NUM - 形成环形缓冲,在NUM文件达到之后;
RPCAP选项:  
remote packet capture protocol,远程抓包协议进行抓包;  
-A: -A <user>:<password>,使用RPCAP密码进行认证;

输入文件:  
-r: -r <infile> 设置读取本地文件

处理选项:  
-2: 执行两次分析  
-R: -R <read filter>,包的读取过滤器,可以在wireshark的filter语法上查看;在wireshark的视图->过滤器视图,在这一栏点击表达式,就会列出来对所有协议的支持。
-Y: -Y <display filter>,使用读取过滤器的语法,在单次分析中可以代替-R选项;  
-n: 禁止所有地址名字解析(默认为允许所有)  
-N: 启用某一层的地址名字解析。“m”代表MAC层,“n”代表网络层,“t”代表传输层,“C”代表当前异步DNS查找。如果-n和-N参数同时存在,-n将被忽略。如果-n和-N参数都不写,则默认打开所有地址名字解析。
-d: 将指定的数据按有关协议解包输出,如要将tcp 8888端口的流量按http解包,应该写为“-d tcp.port==8888,http”;tshark -d. 可以列出所有支持的有效选择器。  

输出选项:  
-w: -w <outfile|-> 设置raw数据的输出文件。这个参数不设置,tshark将会把解码结果输出到stdout,“-w -”表示把raw输出到stdout。如果要把解码结果输出到文件,使用重定向“>”而不要-w参数。  
-F: -F <output file type>,设置输出的文件格式,默认是.pcapng,使用tshark -F可列出所有支持的输出文件类型。  
-V: 增加细节输出;  
-O: -O <protocols>,只显示此选项指定的协议的详细信息。  
-P: 即使将解码结果写入文件中,也打印包的概要信息;  
-S: -S <separator> 行分割符  
-x: 设置在解码输出结果中,每个packet后面以HEX dump的方式显示具体数据。  
-T: -T pdml|ps|text|fields|psml,设置解码结果输出的格式,包括text,ps,psml和pdml,默认为text  
-e: 如果-T fields选项指定,-e用来指定输出哪些字段;  
-E: -E <fieldsoption>=<value>如果-T fields选项指定,使用-E来设置一些属性,比如
header=y|n    
separator=/t|/s|<char>    
occurrence=f|l|a    
aggregator=,|/s|<char>  
-t: -t a|ad|d|dd|e|r|u|ud 设置解码结果的时间格式。“ad”表示带日期的绝对时间,“a”表示不带日期的绝对时间,“r”表示从第一个包到现在的相对时间,“d”表示两个相邻包之间的增量时间(delta)。
  -u: s|hms 格式化输出秒;  
  -l: 在输出每个包之后flush标准输出  
  -q: 结合-z选项进行使用,来进行统计分析;  
  -X: <key>:<value> 扩展项,lua_script、read_format,具体参见 man pages;  
  -z:统计选项,具体的参考文档;tshark -z help,可以列出,-z选项支持的统计方式。  

其他选项:  
-h: 显示命令行帮助;  
-v: 显示tshark 的版本信息;

3.2英文说明文档

1
2
3
4
5
6
7
8
9
10
11
12
13
14
15
16
17
18
19
20
21
22
23
24
25
26
27
28
29
30
31
32
33
34
35
36
37
38
39
40
41
42
43
44
45
46
47
48
49
50
51
52
53
54
55
56
57
58
59
60
61
62
63
64
65
66
67
68
69
70
71
72
73
74
75
76
77
78
79
80
81
82
83
84
85
86
87
88
89
90
91
92
93
94
95
96
97
98
99
100
101
102
103
104
105
106
107
108
109
110
111
112
113
114
115
116
117
118
119
120
121
122
123
124
125
126
127
128
129
130
131
132
133
134
135
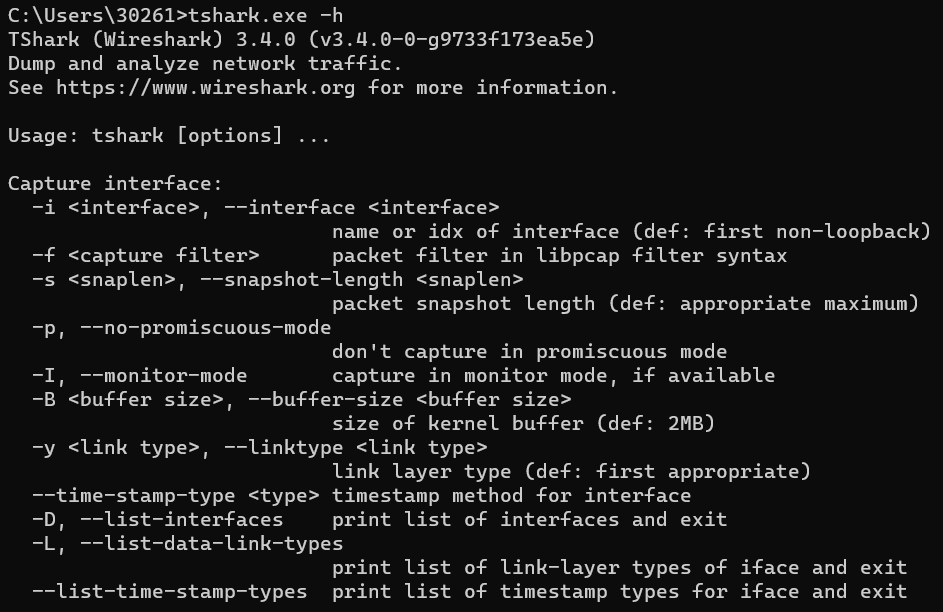
TShark (Wireshark) 3.4.0 (v3.4.0-0-g9733f173ea5e)
Dump and analyze network traffic.
See https://www.wireshark.org for more information.

Usage: tshark [options] ...

Capture interface:
-i <interface>, --interface <interface>
name or idx of interface (def: first non-loopback)
-f <capture filter> packet filter in libpcap filter syntax
-s <snaplen>, --snapshot-length <snaplen>
packet snapshot length (def: appropriate maximum)
-p, --no-promiscuous-mode
don't capture in promiscuous mode
-I, --monitor-mode capture in monitor mode, if available
-B <buffer size>, --buffer-size <buffer size>
size of kernel buffer (def: 2MB)
-y <link type>, --linktype <link type>
link layer type (def: first appropriate)
--time-stamp-type <type> timestamp method for interface
-D, --list-interfaces print list of interfaces and exit
-L, --list-data-link-types
print list of link-layer types of iface and exit
--list-time-stamp-types print list of timestamp types for iface and exit

Capture stop conditions:
-c <packet count> stop after n packets (def: infinite)
-a <autostop cond.> ..., --autostop <autostop cond.> ...
duration:NUM - stop after NUM seconds
filesize:NUM - stop this file after NUM KB
files:NUM - stop after NUM files
packets:NUM - stop after NUM packets
Capture output:
-b <ringbuffer opt.> ..., --ring-buffer <ringbuffer opt.>
duration:NUM - switch to next file after NUM secs
filesize:NUM - switch to next file after NUM KB
files:NUM - ringbuffer: replace after NUM files
packets:NUM - switch to next file after NUM packets
interval:NUM - switch to next file when the time is
an exact multiple of NUM secs
RPCAP options:
-A <user>:<password> use RPCAP password authentication
Input file:
-r <infile>, --read-file <infile>
set the filename to read from (or '-' for stdin)

Processing:
-2 perform a two-pass analysis
-M <packet count> perform session auto reset
-R <read filter>, --read-filter <read filter>
packet Read filter in Wireshark display filter syntax
(requires -2)
-Y <display filter>, --display-filter <display filter>
packet displaY filter in Wireshark display filter
syntax
-n disable all name resolutions (def: all enabled)
-N <name resolve flags> enable specific name resolution(s): "mnNtdv"
-d <layer_type>==<selector>,<decode_as_protocol> ...
"Decode As", see the man page for details
Example: tcp.port==8888,http
-H <hosts file> read a list of entries from a hosts file, which will
then be written to a capture file. (Implies -W n)
--enable-protocol <proto_name>
enable dissection of proto_name
--disable-protocol <proto_name>
disable dissection of proto_name
--enable-heuristic <short_name>
enable dissection of heuristic protocol
--disable-heuristic <short_name>
disable dissection of heuristic protocol
Output:
-w <outfile|-> write packets to a pcapng-format file named "outfile"
(or '-' for stdout)
--capture-comment <comment>
set the capture file comment, if supported
-C <config profile> start with specified configuration profile
-F <output file type> set the output file type, default is pcapng
an empty "-F" option will list the file types
-V add output of packet tree (Packet Details)
-O <protocols> Only show packet details of these protocols, comma
separated
-P, --print print packet summary even when writing to a file
-S <separator> the line separator to print between packets
-x add output of hex and ASCII dump (Packet Bytes)
-T pdml|ps|psml|json|jsonraw|ek|tabs|text|fields|?
format of text output (def: text)
-j <protocolfilter> protocols layers filter if -T ek|pdml|json selected
(e.g. "ip ip.flags text", filter does not expand child
nodes, unless child is specified also in the filter)
-J <protocolfilter> top level protocol filter if -T ek|pdml|json selected
(e.g. "http tcp", filter which expands all child nodes)
-e <field> field to print if -Tfields selected (e.g. tcp.port,
_ws.col.Info)
this option can be repeated to print multiple fields
-E<fieldsoption>=<value> set options for output when -Tfields selected:
bom=y|n print a UTF-8 BOM
header=y|n switch headers on and off
separator=/t|/s|<char> select tab, space, printable character as separator
occurrence=f|l|a print first, last or all occurrences of each field
aggregator=,|/s|<char> select comma, space, printable character as
aggregator
quote=d|s|n select double, single, no quotes for values
-t a|ad|adoy|d|dd|e|r|u|ud|udoy
output format of time stamps (def: r: rel. to first)
-u s|hms output format of seconds (def: s: seconds)
-l flush standard output after each packet
-q be more quiet on stdout (e.g. when using statistics)
-Q only log true errors to stderr (quieter than -q)
-g enable group read access on the output file(s)
-W n Save extra information in the file, if supported.
n = write network address resolution information
-X <key>:<value> eXtension options, see the man page for details
-U tap_name PDUs export mode, see the man page for details
-z <statistics> various statistics, see the man page for details
--export-objects <protocol>,<destdir>
save exported objects for a protocol to a directory
named "destdir"
--color color output text similarly to the Wireshark GUI,
requires a terminal with 24-bit color support
Also supplies color attributes to pdml and psml formats
(Note that attributes are nonstandard)
--no-duplicate-keys If -T json is specified, merge duplicate keys in an object
into a single key with as value a json array containing all
values
--elastic-mapping-filter <protocols> If -G elastic-mapping is specified, put only the
specified protocols within the mapping file

Miscellaneous:
-h, --help display this help and exit
-v, --version display version info and exit
-o <name>:<value> ... override preference setting
-K <keytab> keytab file to use for kerberos decryption
-G [report] dump one of several available reports and exit
default report="fields"
use "-G help" for more help

4.例子

1
2
3
4
5
6
7
8
9
10
11
12
13
14
15
16
17
18
19
20
21
22
23
24
25
26
27
28
29
30
31
32
33
34
35
36
37
38
39
40
41
42
43
44
45
46
47
48
49
50
51
52
53
54
55
56
57
58
59
60
61
62
63
64
65
66
67
68
69
70
//打印http协议流相关信息
tshark -s 512 -i eth0 -n -f 'tcp dst port 80' -R 'http.host and http.request.uri' -T fields -e http.host -e http.request.uri -l | tr -d '\t'
注释:
-s: 只抓取前512字节;
-i: 捕获eth0网卡;
-n: 禁止网络对象名称解析;
-f: 只捕获协议为tcp,目的端口为80;
-R: 过滤出http.host和http.request.uri;
-T,-e: 指的是打印这两个字段;
-I: 输出到命令行界面;

//实时打印当前mysql查询语句
tshark -s 512 -i eth0 -n -f 'tcp dst port 3306' -R 'mysql.query' -T fields -e mysql.query
注释:
-R: 过滤出mysql的查询语句;

//导出smpp协议header和value的例子
tshark -r test.cap -R '(smpp.command_id==0x80000004) and (smpp.command_status==0x0)' -e smpp.message_id -e frame.time -T fields -E header=y >test.txt
注释:
-r: 读取本地文件,可以先抓包存下来之后再进行分析;    
-R: smpp...可以在wireshark的过滤表达式里面找到,后面会详细介绍;    
-E: 当-T字段指定时,设置输出选项,header=y意思是头部要打印;    
-e: 当-T字段指定时,设置输出哪些字段;    
>: 重定向;

//统计http状态
tshark -n -q -z http,stat, -z http,tree   
注释:
-q: 只在结束捕获时输出数据,针对于统计类的命令非常有用;    
-z: 各类统计选项,可以使用tshark -z help命令来查看所有支持的字段;
     http,stat: 计算HTTP统计信息,显示的值是HTTP状态代码和HTTP请求方法。      
     http,tree: 计算HTTP包分布。 显示的值是HTTP请求模式和HTTP状态代码。

//抓取500个包提取访问的网址打印出来
tshark -s 0 -i eth0 -n -f 'tcp dst port 80' -R 'http.host and http.request.uri' -T fields -e http.host -e http.request.uri -l -c 500
注释:     
-f: 抓包前过滤;    
-R: 抓包后过滤;    
-l: 在打印结果之前清空缓存;    
-c: 在抓500个包之后结束;

//读取指定报文,按照ssl过滤显示内容
tshark -r temp.cap -R "ssl" -V -T text  
注释:     
-T text: 格式化输出,默认就是text;    
-V: 增加包的输出;//-q 过滤tcp流13,获取data内容

//提取test.pcapng流量包中的usb.capdata并且写入test.txt
tshark -r 'test.pcapng' -T fields -e usb.capdata > test.txt

//显示ssl data数据
tshark -n -t a -R ssl -T fields -e "ip.src" -e "ssl.app_data"

tshark -r temp.cap -z "follow,tcp,ascii,13"

//按照指定格式显示-e
tshark -r temp.cap -R ssl -Tfields -e "ip.src" -e tcp.srcport -e ip.dst -e tcp.dstport

//输出数据
tshark -r vmx.cap -q -n -t ad -z follow,tcp,ascii,10.1.8.130:56087,10.195.4.41:446 | more
注释:    
-t ad: 输出格式化时间戳;

//过滤包的时间和rtp.seq
tshark -i eth0 -f "udp port 5004" -T fields -e frame.time_epoch -e rtp.seq -o rtp.heuristic_rtp:true 1>test.txt  
注释:    
-o: 覆盖属性文件设置的一些值;

//提取各协议数据部分
tshark -r H:/httpsession.pcap -q -n -t ad -z follow,tcp,ascii,71.6.167.142:27017,101.201.42.120:59381 | more

5.参考链接

tshark官方文档:https://www.wireshark.org/docs/man-pages/tshark.html

wireshark wiki:https://wiki.wireshark.org/

捕获过滤器 https://wiki.wireshark.org/CaptureFilters

显示过滤器,用于display过滤的字段可以通过https://wiki.wireshark.org/DisplayFilters 查询。

如果不过滤-e指定的字段数据都会输出,通过-R过滤之后,只有满足规则的才会输出,会因此-R和-T、-e通常会一起使用。

统计:https://wiki.wireshark.org/Statistics

https://www.cnblogs.com/liun1994/p/6142505.html