└─$ pip2 install yara
DEPRECATION: Python 2.7 reached the end of its life on January 1st, 2020. Please upgrade your Python as Python 2.7 is no longer maintained. pip 21.0 will drop support for Python 2.7 in January 2021. More details about Python 2 support in pip can be found at https://pip.pypa.io/en/latest/development/release-process/#python-2-support pip 21.0 will remove support for this functionality.
Defaulting to user installation because normal site-packages is not writeable
Requirement already satisfied: yara in /home/t/.local/lib/python2.7/site-packages (1.7.7)
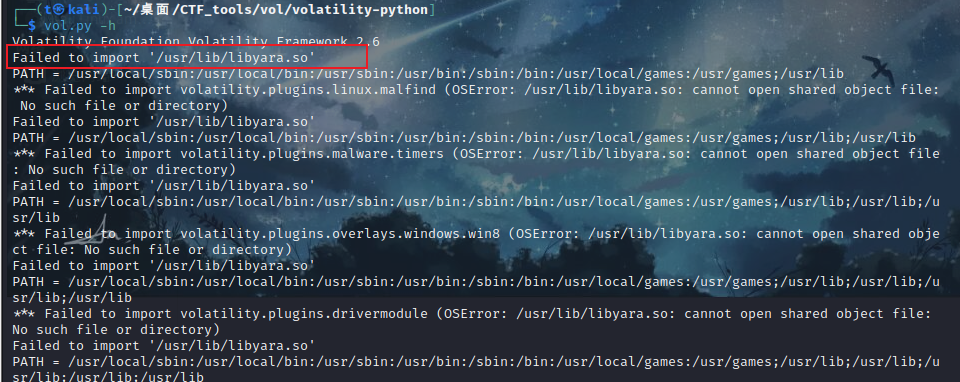
Volatility Foundation Volatility Framework 2.6
*** Failed to import volatility.plugins.mimikatz (ImportError: No module named construct)
ERROR   : volatility.debug    : You must specify something to do (try -h)
└─$ volatility_2.6 -h
Volatility Foundation Volatility Framework 2.6
 Usage: Volatility - A memory forensics analysis platform.

Options:
  -h, --help            list all available options and their default values.
                        Default values may be set in the configuration file
                        (/etc/volatilityrc)
  --conf-file=/home/t/.volatilityrc
                        User based configuration file
  -d, --debug           Debug volatility
  --plugins=PLUGINS     Additional plugin directories to use (colon separated)
  --info                Print information about all registered objects
  --cache-directory=/home/t/.cache/volatility
                        Directory where cache files are stored
  --cache               Use caching
  --tz=TZ               Sets the (Olson) timezone for displaying timestamps
                        using pytz (if installed) or tzset
  -f FILENAME, --filename=FILENAME
                        Filename to use when opening an image
  --profile=WinXPSP2x86
                        Name of the profile to load (use --info to see a list
                        of supported profiles)
  -l LOCATION, --location=LOCATION
                        A URN location from which to load an address space
  -w, --write           Enable write support
  --dtb=DTB             DTB Address
  --shift=SHIFT         Mac KASLR shift address
  --output=text         Output in this format (support is module specific, see
                        the Module Output Options below)
  --output-file=OUTPUT_FILE
                        Write output in this file
  -v, --verbose         Verbose information
  -g KDBG, --kdbg=KDBG  Specify a KDBG virtual address (Note: for 64-bit
                        Windows 8 and above this is the address of
                        KdCopyDataBlock)
  --force               Force utilization of suspect profile
  --cookie=COOKIE       Specify the address of nt!ObHeaderCookie (valid for
                        Windows 10 only)
  -k KPCR, --kpcr=KPCR  Specify a specific KPCR address

        Supported Plugin Commands:

                amcache         Print AmCache information
                apihooks        Detect API hooks in process and kernel memory
                atoms           Print session and window station atom tables
                atomscan        Pool scanner for atom tables
                auditpol        Prints out the Audit Policies from HKLM\SECURITY\Policy\PolAdtEv
                bigpools        Dump the big page pools using BigPagePoolScanner
                bioskbd         Reads the keyboard buffer from Real Mode memory
                cachedump       Dumps cached domain hashes from memory
                callbacks       Print system-wide notification routines
                clipboard       Extract the contents of the windows clipboard
                cmdline         Display process command-line arguments
                cmdscan         Extract command history by scanning for _COMMAND_HISTORY
                connections     Print list of open connections [Windows XP and 2003 Only]
                connscan        Pool scanner for tcp connections
                consoles        Extract command history by scanning for _CONSOLE_INFORMATION
                crashinfo       Dump crash-dump information
                deskscan        Poolscaner for tagDESKTOP (desktops)
                devicetree      Show device tree
                dlldump         Dump DLLs from a process address space
                dlllist         Print list of loaded dlls for each process
                driverirp       Driver IRP hook detection
                drivermodule    Associate driver objects to kernel modules
                driverscan      Pool scanner for driver objects
                dumpcerts       Dump RSA private and public SSL keys
                dumpfiles       Extract memory mapped and cached files
                dumpregistry    Dumps registry files out to disk
                editbox         Displays information about Edit controls. (Listbox experimental.)
                envars          Display process environment variables
                eventhooks      Print details on windows event hooks
                evtlogs         Extract Windows Event Logs (XP/2003 only)
                filescan        Pool scanner for file objects
                gahti           Dump the USER handle type information
                gditimers       Print installed GDI timers and callbacks
                gdt             Display Global Descriptor Table
                getservicesids  Get the names of services in the Registry and return Calculated SID
                getsids         Print the SIDs owning each process
                handles         Print list of open handles for each process
                hashdump        Dumps passwords hashes (LM/NTLM) from memory
                hibinfo         Dump hibernation file information
                hivedump        Prints out a hive
                hivelist        Print list of registry hives.
                hivescan        Pool scanner for registry hives
                hpakextract     Extract physical memory from an HPAK file
                hpakinfo        Info on an HPAK file
                idt             Display Interrupt Descriptor Table
                iehistory       Reconstruct Internet Explorer cache / history
                imagecopy       Copies a physical address space out as a raw DD image
                imageinfo       Identify information for the image
                impscan         Scan for calls to imported functions
                joblinks        Print process job link information
                kdbgscan        Search for and dump potential KDBG values
                kpcrscan        Search for and dump potential KPCR values
                ldrmodules      Detect unlinked DLLs
                lsadump         Dump (decrypted) LSA secrets from the registry
                machoinfo       Dump Mach-O file format information
                malfind         Find hidden and injected code
                mbrparser       Scans for and parses potential Master Boot Records (MBRs)
                memdump         Dump the addressable memory for a process
                memmap          Print the memory map
                messagehooks    List desktop and thread window message hooks
                mftparser       Scans for and parses potential MFT entries
                moddump         Dump a kernel driver to an executable file sample
                modscan         Pool scanner for kernel modules
                modules         Print list of loaded modules
                multiscan       Scan for various objects at once
                mutantscan      Pool scanner for mutex objects
                notepad         List currently displayed notepad text
                objtypescan     Scan for Windows object type objects
                patcher         Patches memory based on page scans
                poolpeek        Configurable pool scanner plugin
                printkey        Print a registry key, and its subkeys and values
                privs           Display process privileges
                procdump        Dump a process to an executable file sample
                pslist          Print all running processes by following the EPROCESS lists
                psscan          Pool scanner for process objects
                pstree          Print process list as a tree
                psxview         Find hidden processes with various process listings
                qemuinfo        Dump Qemu information
                raw2dmp         Converts a physical memory sample to a windbg crash dump
                screenshot      Save a pseudo-screenshot based on GDI windows
                servicediff     List Windows services (ala Plugx)
                sessions        List details on _MM_SESSION_SPACE (user logon sessions)
                shellbags       Prints ShellBags info
                shimcache       Parses the Application Compatibility Shim Cache registry key
                shutdowntime    Print ShutdownTime of machine from registry
                sockets         Print list of open sockets
                sockscan        Pool scanner for tcp socket objects
                ssdt            Display SSDT entries
                strings         Match physical offsets to virtual addresses (may take a while, VERY verbose)
                svcscan         Scan for Windows services
                symlinkscan     Pool scanner for symlink objects
                thrdscan        Pool scanner for thread objects
                threads         Investigate _ETHREAD and _KTHREADs
                timeliner       Creates a timeline from various artifacts in memory
                timers          Print kernel timers and associated module DPCs
                truecryptmaster Recover TrueCrypt 7.1a Master Keys
                truecryptpassphrase     TrueCrypt Cached Passphrase Finder
                truecryptsummary        TrueCrypt Summary
                unloadedmodules Print list of unloaded modules
                userassist      Print userassist registry keys and information
                userhandles     Dump the USER handle tables
                vaddump         Dumps out the vad sections to a file
                vadinfo         Dump the VAD info
                vadtree         Walk the VAD tree and display in tree format
                vadwalk         Walk the VAD tree
                vboxinfo        Dump virtualbox information
                verinfo         Prints out the version information from PE images
                vmwareinfo      Dump VMware VMSS/VMSN information
                volshell        Shell in the memory image
                windows         Print Desktop Windows (verbose details)
                wintree         Print Z-Order Desktop Windows Tree
                wndscan         Pool scanner for window stations
                yarascan        Scan process or kernel memory with Yara signatures
└─$ volatility_2.6 --info Volatility Foundation Volatility Framework 2.6
Profiles -------- VistaSP0x64 - A Profile for Windows Vista SP0 x64 VistaSP0x86 - A Profile for Windows Vista SP0 x86 VistaSP1x64 - A Profile for Windows Vista SP1 x64 VistaSP1x86 - A Profile for Windows Vista SP1 x86 VistaSP2x64 - A Profile for Windows Vista SP2 x64 VistaSP2x86 - A Profile for Windows Vista SP2 x86 Win10x64 - A Profile for Windows 10 x64 Win10x64_10586 - A Profile for Windows 10 x64 (10.0.10586.306 / 2016-04-23) Win10x64_14393 - A Profile for Windows 10 x64 (10.0.14393.0 / 2016-07-16) Win10x86 - A Profile for Windows 10 x86 Win10x86_10586 - A Profile for Windows 10 x86 (10.0.10586.420 / 2016-05-28) Win10x86_14393 - A Profile for Windows 10 x86 (10.0.14393.0 / 2016-07-16) Win2003SP0x86 - A Profile for Windows 2003 SP0 x86 Win2003SP1x64 - A Profile for Windows 2003 SP1 x64 Win2003SP1x86 - A Profile for Windows 2003 SP1 x86 Win2003SP2x64 - A Profile for Windows 2003 SP2 x64 Win2003SP2x86 - A Profile for Windows 2003 SP2 x86 Win2008R2SP0x64 - A Profile for Windows 2008 R2 SP0 x64 Win2008R2SP1x64 - A Profile for Windows 2008 R2 SP1 x64 Win2008R2SP1x64_23418 - A Profile for Windows 2008 R2 SP1 x64 (6.1.7601.23418 / 2016-04-09) Win2008SP1x64 - A Profile for Windows 2008 SP1 x64 Win2008SP1x86 - A Profile for Windows 2008 SP1 x86 Win2008SP2x64 - A Profile for Windows 2008 SP2 x64 Win2008SP2x86 - A Profile for Windows 2008 SP2 x86 Win2012R2x64 - A Profile for Windows Server 2012 R2 x64 Win2012R2x64_18340 - A Profile for Windows Server 2012 R2 x64 (6.3.9600.18340 / 2016-05-13) Win2012x64 - A Profile for Windows Server 2012 x64 Win2016x64_14393 - A Profile for Windows Server 2016 x64 (10.0.14393.0 / 2016-07-16) Win7SP0x64 - A Profile for Windows 7 SP0 x64 Win7SP0x86 - A Profile for Windows 7 SP0 x86 Win7SP1x64 - A Profile for Windows 7 SP1 x64 Win7SP1x64_23418 - A Profile for Windows 7 SP1 x64 (6.1.7601.23418 / 2016-04-09) Win7SP1x86 - A Profile for Windows 7 SP1 x86 Win7SP1x86_23418 - A Profile for Windows 7 SP1 x86 (6.1.7601.23418 / 2016-04-09) Win81U1x64 - A Profile for Windows 8.1 Update 1 x64 Win81U1x86 - A Profile for Windows 8.1 Update 1 x86 Win8SP0x64 - A Profile for Windows 8 x64 Win8SP0x86 - A Profile for Windows 8 x86 Win8SP1x64 - A Profile for Windows 8.1 x64 Win8SP1x64_18340 - A Profile for Windows 8.1 x64 (6.3.9600.18340 / 2016-05-13) Win8SP1x86 - A Profile for Windows 8.1 x86 WinXPSP1x64 - A Profile for Windows XP SP1 x64 WinXPSP2x64 - A Profile for Windows XP SP2 x64 WinXPSP2x86 - A Profile for Windows XP SP2 x86 WinXPSP3x86 - A Profile for Windows XP SP3 x86
Address Spaces -------------- AMD64PagedMemory - Standard AMD 64-bit address space. ArmAddressSpace - Address space for ARM processors FileAddressSpace - This is a direct file AS. HPAKAddressSpace - This AS supports the HPAK format IA32PagedMemory - Standard IA-32 paging address space. IA32PagedMemoryPae - This class implements the IA-32 PAE paging address space. It is responsible LimeAddressSpace - Address space for Lime LinuxAMD64PagedMemory - Linux-specific AMD 64-bit address space. MachOAddressSpace - Address space for mach-o files to support atc-ny memory reader OSXPmemELF - This AS supports VirtualBox ELF64 coredump format QemuCoreDumpElf - This AS supports Qemu ELF32 and ELF64 coredump format VMWareAddressSpace - This AS supports VMware snapshot (VMSS) and saved state (VMSS) files VMWareMetaAddressSpace - This AS supports the VMEM format with VMSN/VMSS metadata VirtualBoxCoreDumpElf64 - This AS supports VirtualBox ELF64 coredump format Win10AMD64PagedMemory - Windows 10-specific AMD 64-bit address space. WindowsAMD64PagedMemory - Windows-specific AMD 64-bit address space. WindowsCrashDumpSpace32 - This AS supports windows Crash Dump format WindowsCrashDumpSpace64 - This AS supports windows Crash Dump format WindowsCrashDumpSpace64BitMap - This AS supports Windows BitMap Crash Dump format WindowsHiberFileSpace32 - This is a hibernate address space for windows hibernation files.
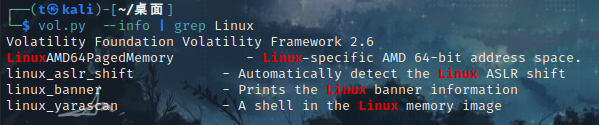
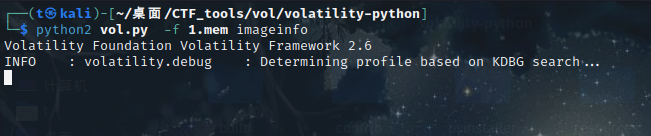
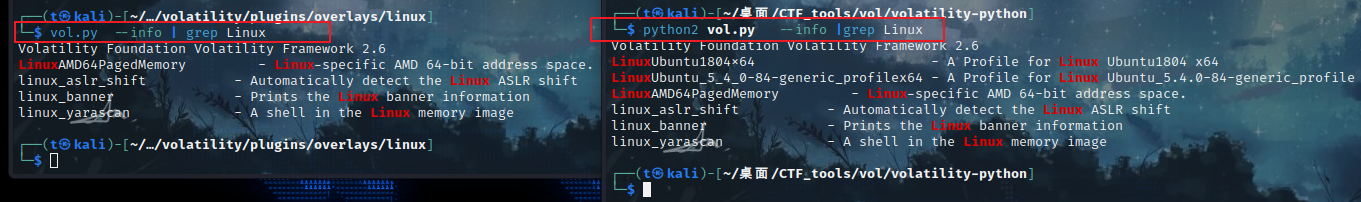
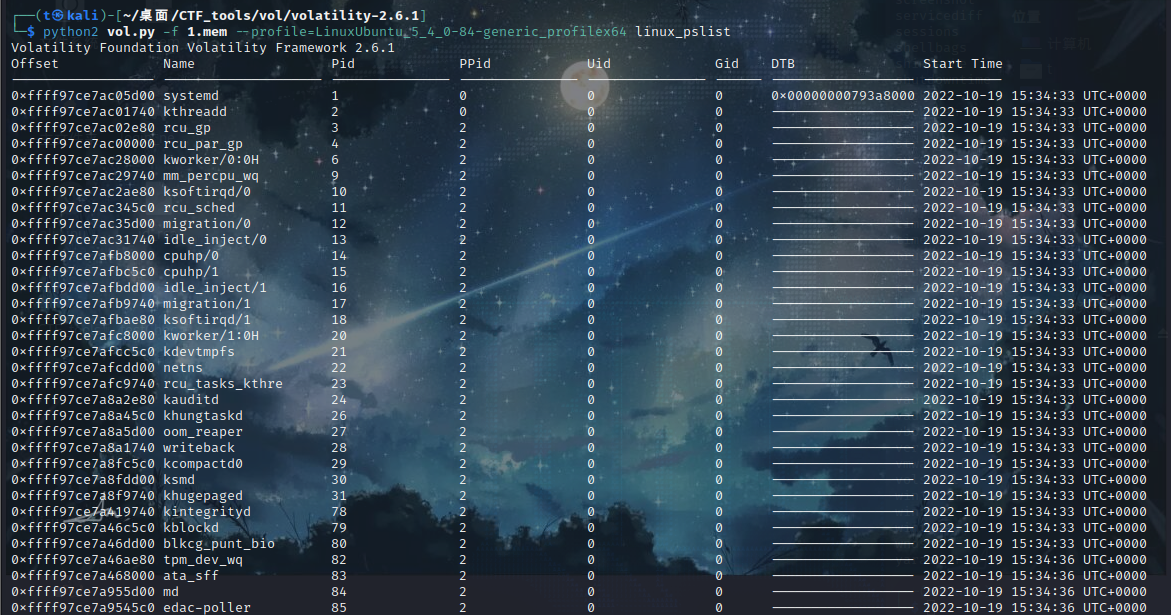
Plugins ------- amcache - Print AmCache information apihooks - Detect API hooks in process and kernel memory atoms - Print session and window station atom tables atomscan - Pool scanner for atom tables auditpol - Prints out the Audit Policies from HKLM\SECURITY\Policy\PolAdtEv bigpools - Dump the big page pools using BigPagePoolScanner bioskbd - Reads the keyboard buffer from Real Mode memory cachedump - Dumps cached domain hashes from memory callbacks - Print system-wide notification routines clipboard - Extract the contents of the windows clipboard cmdline - Display process command-line arguments cmdscan - Extract command history by scanning for _COMMAND_HISTORY connections - Print list of open connections [Windows XP and 2003 Only] connscan - Pool scanner for tcp connections consoles - Extract command history by scanning for _CONSOLE_INFORMATION crashinfo - Dump crash-dump information deskscan - Poolscaner for tagDESKTOP (desktops) devicetree - Show device tree dlldump - Dump DLLs from a process address space dlllist - Print list of loaded dlls for each process driverirp - Driver IRP hook detection drivermodule - Associate driver objects to kernel modules driverscan - Pool scanner for driver objects dumpcerts - Dump RSA private and public SSL keys dumpfiles - Extract memory mapped and cached files dumpregistry - Dumps registry files out to disk editbox - Displays information about Edit controls. (Listbox experimental.) envars - Display process environment variables eventhooks - Print details on windows event hooks evtlogs - Extract Windows Event Logs (XP/2003 only) filescan - Pool scanner for file objects gahti - Dump the USER handle type information gditimers - Print installed GDI timers and callbacks gdt - Display Global Descriptor Table getservicesids - Get the names of services in the Registry and return Calculated SID getsids - Print the SIDs owning each process handles - Print list of open handles for each process hashdump - Dumps passwords hashes (LM/NTLM) from memory hibinfo - Dump hibernation file information hivedump - Prints out a hive hivelist - Print list of registry hives. hivescan - Pool scanner for registry hives hpakextract - Extract physical memory from an HPAK file hpakinfo - Info on an HPAK file idt - Display Interrupt Descriptor Table iehistory - Reconstruct Internet Explorer cache / history imagecopy - Copies a physical address space out as a raw DD image imageinfo - Identify information for the image impscan - Scan for calls to imported functions joblinks - Print process job link information kdbgscan - Search for and dump potential KDBG values kpcrscan - Search for and dump potential KPCR values ldrmodules - Detect unlinked DLLs limeinfo - Dump Lime file format information linux_apihooks - Checks for userland apihooks linux_arp - Print the ARP table linux_aslr_shift - Automatically detect the Linux ASLR shift linux_banner - Prints the Linux banner information linux_bash - Recover bash history from bash process memory linux_bash_env - Recover a process' dynamic environment variables linux_bash_hash - Recover bash hash table from bash process memory linux_check_afinfo - Verifies the operation function pointers of network protocols linux_check_creds - Checks if any processes are sharing credential structures linux_check_evt_arm - Checks the Exception Vector Table to look for syscall table hooking linux_check_fop - Check file operation structures for rootkit modifications linux_check_idt - Checks if the IDT has been altered linux_check_inline_kernel - Check for inline kernel hooks linux_check_modules - Compares module list to sysfs info, if available linux_check_syscall - Checks if the system call table has been altered linux_check_syscall_arm - Checks if the system call table has been altered linux_check_tty - Checks tty devices for hooks linux_cpuinfo - Prints info about each active processor linux_dentry_cache - Gather files from the dentry cache linux_dmesg - Gather dmesg buffer linux_dump_map - Writes selected memory mappings to disk linux_dynamic_env - Recover a process' dynamic environment variables linux_elfs - Find ELF binaries in process mappings linux_enumerate_files - Lists files referenced by the filesystem cache linux_find_file - Lists and recovers files from memory linux_getcwd - Lists current working directory of each process linux_hidden_modules - Carves memory to find hidden kernel modules linux_ifconfig - Gathers active interfaces linux_info_regs - It's like 'info registers' in GDB. It prints out all the linux_iomem - Provides output similar to /proc/iomem linux_kernel_opened_files - Lists files that are opened from within the kernel linux_keyboard_notifiers - Parses the keyboard notifier call chain linux_ldrmodules - Compares the output of proc maps with the list of libraries from libdl linux_library_list - Lists libraries loaded into a process linux_librarydump - Dumps shared libraries in process memory to disk linux_list_raw - List applications with promiscuous sockets linux_lsmod - Gather loaded kernel modules linux_lsof - Lists file descriptors and their path linux_malfind - Looks for suspicious process mappings linux_memmap - Dumps the memory map for linux tasks linux_moddump - Extract loaded kernel modules linux_mount - Gather mounted fs/devices linux_mount_cache - Gather mounted fs/devices from kmem_cache linux_netfilter - Lists Netfilter hooks linux_netscan - Carves for network connection structures linux_netstat - Lists open sockets linux_pidhashtable - Enumerates processes through the PID hash table linux_pkt_queues - Writes per-process packet queues out to disk linux_plthook - Scan ELF binaries' PLT for hooks to non-NEEDED images linux_proc_maps - Gathers process memory maps linux_proc_maps_rb - Gathers process maps for linux through the mappings red-black tree linux_procdump - Dumps a process's executable image to disk linux_process_hollow - Checks for signs of process hollowing linux_psaux - Gathers processes along with full command line and start time linux_psenv - Gathers processes along with their static environment variables linux_pslist - Gather active tasks by walking the task_struct->task list linux_pslist_cache - Gather tasks from the kmem_cache linux_psscan - Scan physical memory for processes linux_pstree - Shows the parent/child relationship between processes linux_psxview - Find hidden processes with various process listings linux_recover_filesystem - Recovers the entire cached file system from memory linux_route_cache - Recovers the routing cache from memory linux_sk_buff_cache - Recovers packets from the sk_buff kmem_cache linux_slabinfo - Mimics /proc/slabinfo on a running machine linux_strings - Match physical offsets to virtual addresses (may take a while, VERY verbose) linux_threads - Prints threads of processes linux_tmpfs - Recovers tmpfs filesystems from memory linux_truecrypt_passphrase - Recovers cached Truecrypt passphrases linux_vma_cache - Gather VMAs from the vm_area_struct cache linux_volshell - Shell in the memory image linux_yarascan - A shell in the Linux memory image lsadump - Dump (decrypted) LSA secrets from the registry mac_adium - Lists Adium messages mac_apihooks - Checks for API hooks in processes mac_apihooks_kernel - Checks to see if system call and kernel functions are hooked mac_arp - Prints the arp table mac_bash - Recover bash history from bash process memory mac_bash_env - Recover bash's environment variables mac_bash_hash - Recover bash hash table from bash process memory mac_calendar - Gets calendar events from Calendar.app mac_check_fop - Validate File Operation Pointers mac_check_mig_table - Lists entires in the kernel's MIG table mac_check_syscall_shadow - Looks for shadow system call tables mac_check_syscalls - Checks to see if system call table entries are hooked mac_check_sysctl - Checks for unknown sysctl handlers mac_check_trap_table - Checks to see if mach trap table entries are hooked mac_compressed_swap - Prints Mac OS X VM compressor stats and dumps all compressed pages mac_contacts - Gets contact names from Contacts.app mac_dead_procs - Prints terminated/de-allocated processes mac_dead_sockets - Prints terminated/de-allocated network sockets mac_dead_vnodes - Lists freed vnode structures mac_devfs - Lists files in the file cache mac_dmesg - Prints the kernel debug buffer mac_dump_file - Dumps a specified file mac_dump_maps - Dumps memory ranges of process(es), optionally including pages in compressed swap mac_dyld_maps - Gets memory maps of processes from dyld data structures mac_find_aslr_shift - Find the ASLR shift value for 10.8+ images mac_get_profile - Automatically detect Mac profiles mac_ifconfig - Lists network interface information for all devices mac_interest_handlers - Lists IOKit Interest Handlers mac_ip_filters - Reports any hooked IP filters mac_kernel_classes - Lists loaded c++ classes in the kernel mac_kevents - Show parent/child relationship of processes mac_keychaindump - Recovers possbile keychain keys. Use chainbreaker to open related keychain files mac_ldrmodules - Compares the output of proc maps with the list of libraries from libdl mac_librarydump - Dumps the executable of a process mac_list_files - Lists files in the file cache mac_list_kauth_listeners - Lists Kauth Scope listeners mac_list_kauth_scopes - Lists Kauth Scopes and their status mac_list_raw - List applications with promiscuous sockets mac_list_sessions - Enumerates sessions mac_list_zones - Prints active zones mac_lsmod - Lists loaded kernel modules mac_lsmod_iokit - Lists loaded kernel modules through IOkit mac_lsmod_kext_map - Lists loaded kernel modules mac_lsof - Lists per-process opened files mac_machine_info - Prints machine information about the sample mac_malfind - Looks for suspicious process mappings mac_memdump - Dump addressable memory pages to a file mac_moddump - Writes the specified kernel extension to disk mac_mount - Prints mounted device information mac_netstat - Lists active per-process network connections mac_network_conns - Lists network connections from kernel network structures mac_notesapp - Finds contents of Notes messages mac_notifiers - Detects rootkits that add hooks into I/O Kit (e.g. LogKext) mac_orphan_threads - Lists threads that don't map back to known modules/processes mac_pgrp_hash_table - Walks the process group hash table mac_pid_hash_table - Walks the pid hash table mac_print_boot_cmdline - Prints kernel boot arguments mac_proc_maps - Gets memory maps of processes mac_procdump - Dumps the executable of a process mac_psaux - Prints processes with arguments in user land (**argv) mac_psenv - Prints processes with environment in user land (**envp) mac_pslist - List Running Processes mac_pstree - Show parent/child relationship of processes mac_psxview - Find hidden processes with various process listings mac_recover_filesystem - Recover the cached filesystem mac_route - Prints the routing table mac_socket_filters - Reports socket filters mac_strings - Match physical offsets to virtual addresses (may take a while, VERY verbose) mac_tasks - List Active Tasks mac_threads - List Process Threads mac_threads_simple - Lists threads along with their start time and priority mac_timers - Reports timers set by kernel drivers mac_trustedbsd - Lists malicious trustedbsd policies mac_version - Prints the Mac version mac_vfsevents - Lists processes filtering file system events mac_volshell - Shell in the memory image mac_yarascan - Scan memory for yara signatures machoinfo - Dump Mach-O file format information malfind - Find hidden and injected code mbrparser - Scans for and parses potential Master Boot Records (MBRs) memdump - Dump the addressable memory for a process memmap - Print the memory map messagehooks - List desktop and thread window message hooks mftparser - Scans for and parses potential MFT entries moddump - Dump a kernel driver to an executable file sample modscan - Pool scanner for kernel modules modules - Print list of loaded modules multiscan - Scan for various objects at once mutantscan - Pool scanner for mutex objects netscan - Scan a Vista (or later) image for connections and sockets notepad - List currently displayed notepad text objtypescan - Scan for Windows object type objects patcher - Patches memory based on page scans poolpeek - Configurable pool scanner plugin pooltracker - Show a summary of pool tag usage printkey - Print a registry key, and its subkeys and values privs - Display process privileges procdump - Dump a process to an executable file sample pslist - Print all running processes by following the EPROCESS lists psscan - Pool scanner for process objects pstree - Print process list as a tree psxview - Find hidden processes with various process listings qemuinfo - Dump Qemu information raw2dmp - Converts a physical memory sample to a windbg crash dump screenshot - Save a pseudo-screenshot based on GDI windows servicediff - List Windows services (ala Plugx) sessions - List details on _MM_SESSION_SPACE (user logon sessions) shellbags - Prints ShellBags info shimcache - Parses the Application Compatibility Shim Cache registry key shutdowntime - Print ShutdownTime of machine from registry sockets - Print list of open sockets sockscan - Pool scanner for tcp socket objects ssdt - Display SSDT entries strings - Match physical offsets to virtual addresses (may take a while, VERY verbose) svcscan - Scan for Windows services symlinkscan - Pool scanner for symlink objects thrdscan - Pool scanner for thread objects threads - Investigate _ETHREAD and _KTHREADs timeliner - Creates a timeline from various artifacts in memory timers - Print kernel timers and associated module DPCs truecryptmaster - Recover TrueCrypt 7.1a Master Keys truecryptpassphrase - TrueCrypt Cached Passphrase Finder truecryptsummary - TrueCrypt Summary unloadedmodules - Print list of unloaded modules userassist - Print userassist registry keys and information userhandles - Dump the USER handle tables vaddump - Dumps out the vad sections to a file vadinfo - Dump the VAD info vadtree - Walk the VAD tree and display in tree format vadwalk - Walk the VAD tree vboxinfo - Dump virtualbox information verinfo - Prints out the version information from PE images vmwareinfo - Dump VMware VMSS/VMSN information volshell - Shell in the memory image win10cookie - Find the ObHeaderCookie value for Windows 10 windows - Print Desktop Windows (verbose details) wintree - Print Z-Order Desktop Windows Tree wndscan - Pool scanner for window stations yarascan - Scan process or kernel memory with Yara signatures
Scanner Checks -------------- CheckPoolSize - Check pool block size CheckPoolType - Check the pool type KPCRScannerCheck - Checks the self referential pointers to find KPCRs MultiPrefixFinderCheck - Checks for multiple strings per page, finishing at the offset MultiStringFinderCheck - Checks for multiple strings per page PoolTagCheck - This scanner checks for the occurance of a pool tag
Profiles -------- VistaSP0x64 - Windows Vista SP0 x64 的配置文件 VistaSP0x86 - Windows Vista SP0 x86 的配置文件 VistaSP1x64 - Windows Vista SP1 x64 的配置文件 VistaSP1x86 - Windows Vista SP1 x86 的配置文件 VistaSP2x64 - Windows Vista SP1 x86 的配置文件 VistaSP2x86 - Windows Vista SP2 x64 的配置文件 Win10x64 - Windows 10 x64 的配置文件 Win10x64_10586 - Windows 10 x64 的配置文件 (10.0.10586.306 / 2016-04-23) Win10x64_14393 - Windows 10 x64 的配置文件 (10.0.14393.0 / 2016-07-16) Win10x86 - Windows 10 x86 的配置文件 Win10x86_10586 - Windows 10 x86 的配置文件 (10.0.10586.420 / 2016-05-28) Win10x86_14393 - Windows 10 x86 的配置文件 (10.0.14393.0 / 2016-07-16) Win2003SP0x86 - Windows 2003 SP0 x86 的配置文件 Win2003SP1x64 - Windows 2003 SP0 x86 的配置文件 Win2003SP1x86 - Windows 2003 SP1 x86 的配置文件 Win2003SP2x64 - Windows 2003 SP1 x86 的配置文件 Win2003SP2x86 - Windows 2003 SP2 x86 的配置文件 Win2008R2SP0x64 - Windows 2008 R2 SP0 x64 的配置文件 Win2008R2SP1x64 - Windows 2008 R2 SP1 x64 的配置文件 Win2008R2SP1x64_23418 - Windows 2008 R2 SP1 x64 的配置文件 (6.1.7601.23418 / 2016-04-09) Win2008SP1x64 - Windows 2008 SP1 x64 的配置文件 Win2008SP1x86 - Windows 2008 SP1 x86 的配置文件 Win2008SP2x64 - Windows 2008 SP2 x64 的配置文件 Win2008SP2x86 - Windows 2008 SP2 x86 的配置文件 Win2012R2x64 - Windows Server 2012 R2 x64 的配置文件 Win2012R2x64_18340 - Windows Server 2012 R2 x64 的配置文件 (6.3.9600.18340 / 2016-05-13) Win2012x64 - Windows Server 2012 x64 的配置文件 Win2016x64_14393 - Windows Server 2016 x64 的配置文件 (10.0.14393.0 / 2016-07-16) Win7SP0x64 - Windows 7 SP0 x64 的配置文件 Win7SP0x86 - Windows 7 SP0 x86 的配置文件 Win7SP1x64 - Windows 7 SP1 x64 的配置文件 Win7SP1x64_23418 - Windows 7 SP1 x64 的配置文件 (6.1.7601.23418 / 2016-04-09) Win7SP1x86 - Windows 7 SP1 x86 的配置文件 Win7SP1x86_23418 - Windows 7 SP1 x86 的配置文件 (6.1.7601.23418 / 2016-04-09) Win81U1x64 - Windows 8.1 更新 1 x64 的配置文件 Win81U1x86 - Windows 8.1 更新 1 x86 的配置文件 Win8SP0x64 - Windows 8 x64 的配置文件 Win8SP0x86 - Windows 8 x86 的配置文件 Win8SP1x64 - Windows 8.1 x64 的配置文件 Win8SP1x64_18340 - Windows 8.1 x64 的配置文件 (6.3.9600.18340 / 2016-05-13) Win8SP1x86 - Windows 8.1 x86 的配置文件 WinXPSP1x64 - Windows XP SP1 x64 的配置文件 WinXPSP2x64 - Windows XP SP2 x64 的配置文件 WinXPSP2x86 - Windows XP SP2 x86 的配置文件 WinXPSP3x86 - Windows XP SP3 x86 的配置文件
Address Spaces -------------- AMD64PagedMemory - 标准 AMD 64 位地址空间 ArmAddressSpace - ARM 处理器的地址空间 FileAddressSpace - 这是一个直接文件 AS. HPAKAddressSpace - 此 AS 支持 HPAK 格式 IA32PagedMemory - 标准 IA-32 分页地址空间 IA32PagedMemoryPae - 此类实现 IA-32 PAE 分页地址空间 LimeAddressSpace - Lime 的地址空间 LinuxAMD64PagedMemory - Linux 特定的 AMD 64 位地址空间 MachOAddressSpace - mach-o 文件的地址空间以支持 atc-ny 内存读取器 OSXPmemELF - 这个 AS 支持 VirtualBox ELF64 coredump 格式 QemuCoreDumpElf - 这个 AS 支持 Qemu ELF32 和 ELF64 核心转储格式 VMWareAddressSpace - 此 AS 支持 VMware 快照 (VMSS) 和保存状态 (VMSS) 文件 VMWareMetaAddressSpace - 此 AS 支持带有 VMSN/VMSS 元数据的 VMEM 格式 VirtualBoxCoreDumpElf64 - 这个 AS 支持 VirtualBox ELF64 coredump 格式 Win10AMD64PagedMemory - Windows 10 特定的 AMD 64 位地址空间 WindowsAMD64PagedMemory - Windows 特定的 AMD 64 位地址空间 WindowsCrashDumpSpace32 - 这个 AS 支持 windows 崩溃转储格式 WindowsCrashDumpSpace64 - 此 AS 支持 windows Crash Dump 格式 WindowsCrashDumpSpace64BitMap - 此 AS 支持 Windows BitMap Crash Dump 格式 WindowsHiberFileSpace32 - 这是 Windows 休眠文件的休眠地址空间

 微信
微信